Tyres I: Tyre Wear Energy

Tyres are one of the main factors impacting performance. In F1, they have been a relevant — and often controversial — topic ever since the early days of racing. From treaded versus slick tyres, to six-wheeled cars and manufacturer wars, and especially since Pirelli joined F1 in 2011, being the fastest car on track has not been the only way to win races — managing tyre wear has become just as critical.
Race setup philosophy has evolved from maximizing peak performance to achieving a balance that extends tyre life.
But it’s not only about setup. Drivers are now trained from junior categories such as F4 to manage tyres, so that by the time they reach higher levels, tyre management is second nature.
In this article, we will explore the key metric used to evaluate tyre degradation: tyre wear energy.
How to Calculate Tyre Wear Energy
WARNING: This section gets mathematical. Feel free to skip ahead if you prefer to go straight to the analysis.
Let's start with the physics behind it: energy is calculated as the power accumulated over time, and power is the result of multiplying force by velocity.
So if we are able to measure the forces acting in a tyre, using it's velocity we will be able to transform all of these inputs into our tyre wear energy.

As there are many forces acting on the tyres at the same time, we will divide the problem into two components to make the analysis easier:
- Longitudinal wear energy
- Lateral wear energy
Both are calculated in a similar way: as the product of tyre sliding velocity and in-plane tyre force.
Neglecting thermal and rolling resistance effects, wear energy is only generated when sliding occurs. Without sliding, there would be no wear — but also no grip.
With that in mind, let’s start with the longitudinal component.
Longitudinal Wear Energy
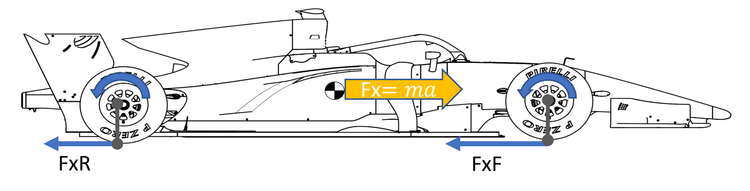
Longitudinal sliding is related to the slip ratio (SR), which represents the difference between the vehicle speed and the tyre’s effective rolling speed at the contact patch.
For readers less familiar with this concept, the slip ratio is defined as the relative difference between the ground speed and the linear velocity at the contact patch.
As a rule of thumb, a tyre typically achieves maximum grip at a slip ratio of around 0.1.

The longitudinal tyre wear energy can therefore be expressed as:

Being:
ω: Rotational speed at the wheel in rad/s.
Rr: Rolling radius of the tyre.
Vcar: Ground speed of the vehicle.
FxTyre: Longitudinal force developed by that tyre.
Lateral Wear Energy
The lateral component is calculated in a similar way, using the lateral force and the lateral sliding velocity of the tyre.
To determine lateral velocity, we introduce the concept of slip angle.
The slip angle is the angle between the direction the Rim is pointing and the actual direction of travel.

As with the longitudinal component, the maximum lateral force achievable relies directly in the slip angle being developed at a time.

In real-world applications, this angle is difficult to measure directly, but it can be derived through a set of mathematical relationships (which we will skip here for simplicity).
Using simulation tools such as Etecmo Simulation Suite, this value can be obtained directly.
Once the slip angle is known, the lateral velocity component is calculated via trigonometry to have a final lateral wear energy equation as:

Total Tyre Wear Energy
The total wear energy per tyre is simply the sum of both components:

How to Save Your Tyres
Which driving techniques can be used to reduce tyre wear energy?
There are many, but let’s go through some of the most effective ones.
Throttle Aggression
As discussed earlier, a high slip ratio leads to higher tyre wear energy. Applying the throttle more progressively reduces slip and therefore limits wear.
We stated that the thermal effects were discarded for this article, but it's also worth mentioning that the higher the slip ratio, the more heat will be induced into the rear tyres via wheelspin.
Lift and Coast + Braking Aggression
Lifting off the throttle before the braking zone allows aerodynamic drag to slow the car down without loading the tyres. This is essentially “free” deceleration that does not contribute to wear.

The longer the lift-and-coast phase, the greater the tyre saving — but at the cost of lap time.
Similarly, reducing braking aggression lowers negative slip ratio and wear, but reduces braking efficiency.
Reducing Minimum Speed in Fast Corners
Fast corners (such as T3, T9, and T14 in Barcelona) generate the highest tyre wear energy due to large lateral forces.
Reducing minimum corner speed while not changing the racing line decreases both lateral force and slip angle, and as a consequence the wear energy.

The trade-off, of course, is lap time.
Testing
The calculations presented earlier may seem complex, but if your vehicle model already computes tyre wear energy, it can be directly visualized through the data acquisition system.
To evaluate these techniques, we used a combination known for high tyre degradation:
- FIA F3 car
- Circuit de Barcelona-Catalunya
- Vehicle model from Canopy Simulations
Two simulations were performed:
- Full push lap
- Tyre-saving driving approach using the techniques described above
The goal was to quantify how much wear energy could be saved and at what lap time cost.
Results


From the graphs above we can see how the full push lap develops much more wear power than the lap applying saving techniques. To be able to quantify this difference, we must integrate this power to speak in energy terms, plotting then some bar graphs to analyse the results.
As expected, in the graph below you will see that due to the predominance of right-hand corners in Barcelona, the left-side tyres accumulate the most wear energy. The rear tyres show slightly higher wear than the front.

The highest wear energy occurs in fast corners — particularly T3, T9, and T14, as seen in the graph below, where we will divide the wear energy per tyre and per corner.

The following graphs represents the % of energy saved during the lap completed in the DIL applying tyre-saving techniques. The largest reductions in wear energy were observed in T2-3, T4 and T9:

However, tyre saving must always be balanced against lap time. Comparing both laps, this was the difference in lap time corner by corner:

The key question becomes: where is it worth saving tyres?
To answer this, we define a metric of saving efficiency, expressed as:

From this analysis, the most efficient corner for tyre saving is T9, followed by T14 and T4. This means the corners where most energy is saved for the time lost:

Notes and Conclusions
- Practicing tyre-saving techniques in DiL improves consistency and can enhance real-track setup items testing efficiency.
- If a grip degradation model based on wear energy is available, integrating it into DiL allows drivers to feel the consequences of their actions during long runs. If not available you should start to work on it now...
- These calculations can be performed directly within lap time simulation tools. The recommended workflow is:
- lap time Simulation
- Correlation with Driver-in-the-Loop (DiL)
- Final validation on track
- Always consider context: tyre saving is not always optimal or needed. Its importance depends heavily on circuit characteristics and tyre compounds. For example, focusing on tyre wear in Monaco is far less important than in Bahrain. Defining a tyre energy per km graph for all the tracks in the calendar will be key to identify whether tyre wear is relevant or not.
- Road surface roughness could also be added as a factor together with the tyre wear energy to estimate tyre wear in mm.
Use your preparation time wisely.
FOOD FOR THOUGHT SECTION
This section has been added to give a few ideas of applications that any user could introduce after acquiring this knowledge.
Influence of Tyre Wear Energy on Physical Tyre Wear
The best way to physically know how much a tyre is worn, is by measuring them. This is done using some reference holes which are included in any tyre when fabricated by a manufacturer.
After tyre usage, they must be cleaned with heat guns and spatulas, and then the hole depth compared with the original one to know how much rubber was consumed.

As the holes are in line throughout the width of the tyre, the final result is a graph like the following.

So, as an idea, what if somebody develops a model that relates the tyre wear energy measured in data directly to the physical tyre wear? This model would have to include some factors to take into account the characteristics of the asphalt of each track, but when properly adjusted and validated , it can be introduced in the simulator and have a result of physical tyre wear after a long run simulation. This, together with tyre wear vs. grip models, will allow drivers to cover a race distance while experiencing the impact of different tyre-saving techniques on total race time.
In the graph below we represent a real race plot where the driver in purple does not apply any tyre saving technique during the first half of the race:
The y axis represents the distance between the leader and these both cars. As it can be seen the black car was saving tyres for the whole race, being up to 6 seconds behind the purple car, but catching up and overtaking him by lap 16, to then build a gap of nearly 10 seconds in the last 4 laps.

Influence of Racing Line on Tyre wear Energy
This is highly situational. Depending on the car and corner, alternative lines can reduce tyre energy with minimal lap time loss.
In the following example we can see two possible lines for a hairpin. The red one will use more longitudinal energy, as it will brake laterwith the car already pointing to the corner, have less minimum speed to then accelerate with the car already pointing to the outside of the corner.

In the moment of minimum speed, the red car will use all of the lateral force to rotate the car, but as the speed is low, this will induce low wear lateral energy.
Meanwhile, the blue line car, will use more lateral energy earlier to be able to stay in the tighter line, using lateral wear energy on entry, and then will have more lateral to do on exit when applying throttle.
Which one is the correct line then? Well, the answer is that it depends on the situation. Are you struggling with the lateral wear energy? Use the red line! Are you struggling with longitudinal? Use the blue!
Liked this article? Check the effect of atmospheric pressure in this other one
 Antonio Ortiz Poveda